
NBA Back-to-Back Betting: Why the Schedule Is a Sharper Edge Than You Think
 Available in US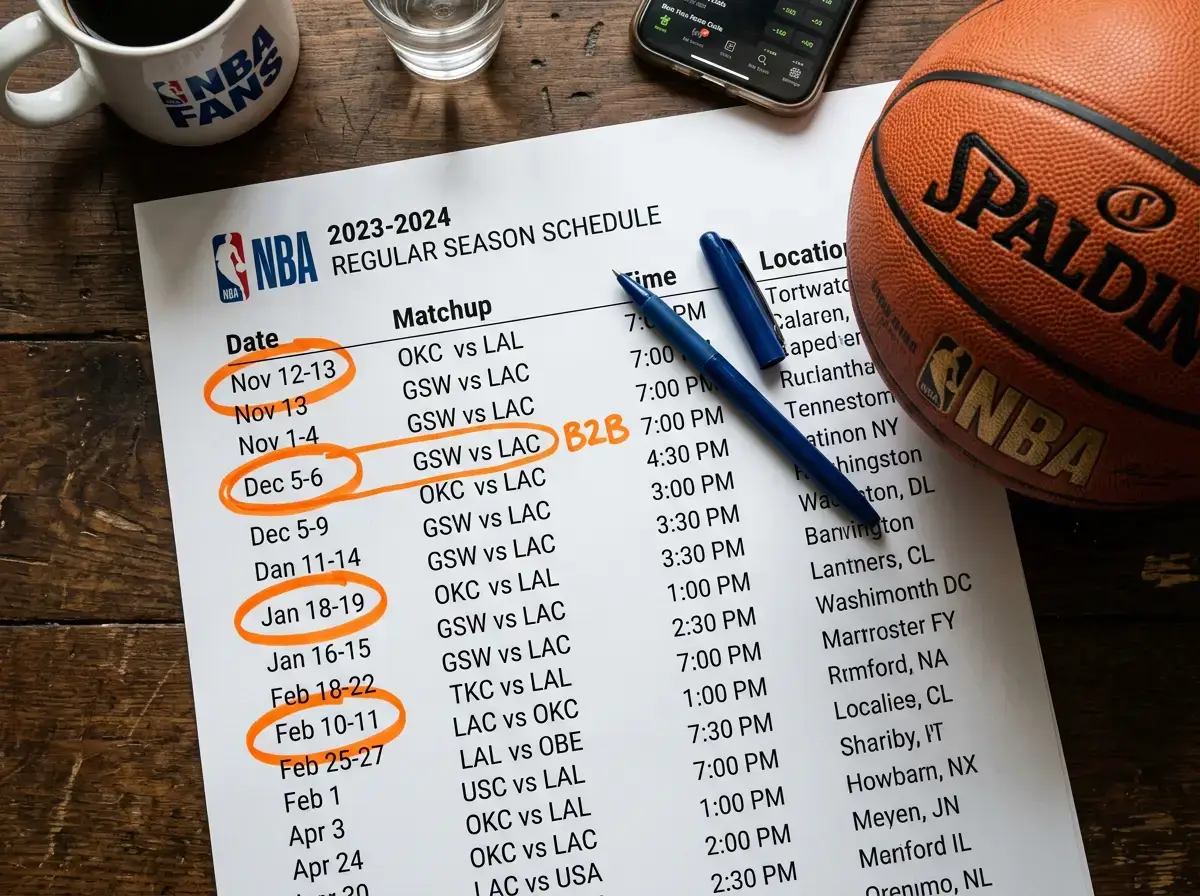
The NBA Has Cut Back-to-Backs by 23% in a Decade — But the ATS Edge on Tired Teams Remains
Every October I download the full NBA schedule and colour-code every back-to-back set for every team. It takes about two hours, and it is the single most productive piece of pre-season preparation I do. The schedule is public, the fatigue patterns are predictable, and the market still does not fully account for the specific context of each back-to-back. That gap is where I have made some of my most consistent returns over the past nine years. See also betting tips basketball nba for the complete NBA betting tips guide.
Back-to-back games — where a team plays two games on consecutive nights — averaged 14.9 per team during the 2024–25 season, down 23% from a decade earlier. The NBA has actively compressed the schedule to reduce fatigue, and the league markets that effort as a player-welfare initiative. For bettors, the reduction has an unintended consequence: fewer data points mean each remaining back-to-back carries more uncertainty, and the market’s generic adjustment has fewer opportunities to calibrate itself. The aggregate trend, though, is remarkably persistent — teams on the second night of a back-to-back lose against the spread 57% of the time when facing a rested opponent.
Second-Night ATS Performance: The 57% Failure Rate Explained
A 57% ATS loss rate sounds modest until you put it in the context of a market designed to be 50/50. In a world where the bookmaker’s spread is perfectly calibrated, both sides should cover roughly half the time. A seven-point deviation from that baseline represents genuine inefficiency — and it is consistent enough across seasons that it qualifies as one of the most durable situational edges in NBA betting.
The mechanism is straightforward. Players who competed for forty-eight minutes last night — or even thirty-two minutes off the bench — have not fully recovered. Sleep is compressed, especially on road back-to-backs where the team may have travelled between cities overnight. The effect shows up in fourth-quarter performance more than anywhere else: fatigued teams shoot worse from three, turn the ball over at higher rates, and their defensive rotations slow by a half-step that compounds over dozens of possessions.
What the 57% figure does not tell you is how much of that edge the bookmaker has already priced in. If the market adjusts the spread by 1.5 points for a back-to-back — and it often does — then the remaining edge is smaller than the raw number implies. The profitable approach is not to blindly bet against every back-to-back team, but to identify the subset of back-to-backs where the adjustment is insufficient. Road back-to-backs with travel across time zones, games where the fatigued team played overtime the previous night, and situations where the rested opponent had two or more days off — these are the spots where the 57% rate likely understates the true disadvantage.
Rest Asymmetry: Rested vs Fatigued Matchups and How to Spot Them
Not all rest advantages are created equal. A team with one day off playing against a back-to-back team is a different situation from a team with three days off playing against the same opponent. I categorise rest asymmetries on a simple scale: zero days off versus one day off is a mild edge; zero versus two is significant; zero versus three or more is the strongest situation I track.
The easiest way to find these asymmetries is to look at the schedule two weeks out. Identify the nights where one team is on the second game of a back-to-back and the other team has not played in forty-eight hours or more. These games are rare — perhaps three or four per team per season — but they represent the highest-confidence rest-related plays available. When one crops up, I check whether the spread already reflects the full asymmetry. If the rested team is a 3-point favourite in a game where their quality rating and the rest advantage suggest they should be favoured by 5 or 6, the bet presents itself.
Schedule density also matters beyond individual back-to-backs. A team playing its fourth game in six nights accumulates fatigue that is not captured by looking at a single day’s rest. I keep a rolling count of games played in the last seven days for both teams in any matchup, and when the gap is two or more games, I treat the less-rested team as if they are on a back-to-back regardless of whether they technically are one. Home court advantage data becomes especially useful here — a fatigued team at home still has the comfort of their own arena, but a fatigued team on the road faces the worst possible combination of stressors.
Load Management and Its Betting Implications: When Stars Sit on B2Bs
Load management has changed back-to-back betting in ways that the traditional fatigue model does not fully capture. A decade ago, coaches played their starters on both nights of a back-to-back almost without exception. Today, resting star players on the second night is standard practice for any team with realistic playoff ambitions. The NBA’s revised injury reporting rules — teams now submit game-day reports between 11:00 and 13:00 local time and update them every fifteen minutes — give bettors more information about who will sit, but the timing creates its own challenge.
The market adjusts rapidly when a star player is ruled out. A team’s spread can shift by three to five points within minutes of an injury report update. The bettors who profit from load management are the ones who anticipate it before the report drops. If a team’s franchise player logged forty minutes last night in a physical loss, the probability that he sits tonight is high, and you can position yourself before the market corrects. This is not insider information — it is pattern recognition based on publicly available minutes data, the team’s stated load management philosophy, and the game’s importance in the standings.
The trap is assuming that a team without its star automatically becomes a fade. Some squads have deep enough rosters that losing one player does not collapse their competitive level. Others rely so heavily on a single creator that his absence drops them by ten points of expected margin. Knowing the difference is what separates a profitable load management play from an overreaction in the opposite direction.
Turning Schedule Data Into a Seasonal Filter
I do not treat back-to-back analysis as a standalone strategy. It is a filter — one of several that I apply to narrow the nightly slate from twelve or fifteen games down to two or three actionable bets. When a back-to-back situation aligns with other edges I have identified — a pace mismatch, a defensive rating gap, or a team-level ATS trend — the confidence level rises. When the back-to-back is the only thing I have, I usually pass.
The schedule is the only piece of NBA data that is fully known before the season starts. Every other variable — injuries, form, line movement — unfolds in real time. That forward visibility is the real advantage of back-to-back analysis. You can plan your bets weeks in advance, set alerts for the matchups that interest you, and avoid the last-minute scramble that pushes most bettors into poorly researched positions. The teams that suffer most on back-to-backs are the ones that cannot manage the physical cost of compression. The bettors who profit most are the ones who plan for it before the schedule becomes a talking point on broadcast. See also home court advantage on back-to-back nights.
How do back-to-back games affect NBA betting results?
Teams on the second night of a back-to-back lose against the spread approximately 57% of the time against rested opponents. The effect is strongest on road back-to-backs with cross-timezone travel and weakest on home back-to-backs with minimal travel. The bookmaker adjusts for this, so the raw percentage overstates the exploitable edge.
How many back-to-back games does each NBA team play per season?
In the 2024-25 season, the average was 14.9 back-to-back sets per team, down 23% from a decade ago. The NBA continues to reduce these through scheduling changes, which means each remaining back-to-back carries slightly more weight in fatigue analysis.
Should I always bet against teams on the second night of a back-to-back?
No. Blindly fading every back-to-back team ignores the spread adjustment that bookmakers already apply. The profitable approach is selective: target games where the rest asymmetry is large, the travel is demanding, or a star player is likely to sit due to load management. Use back-to-back status as one filter among several, not a standalone system.
This material was created by the CourtEdge team.
Related posts

NBA Betting Advertising Regulation: How UK and US Rules Affect What Punters See
NBA Team Betting Trends: ATS Records, Cover Rates, and Where to Find Persistent Edges